Chapter 1: Introduction
Wind energy development is expanding rapidly, creating many opportunities for communities to participate in wind development. Windy acreage, once cursed for losing top soil, is now seen as a potential goldmine. Wind energy offers many financial, environmental, and social benefits to the communities and individuals who choose to get involved with its development.
The concept of community wind is simple and flexible. Projects can be any size – one turbine or one hundred, usually commercial-scale and greater than 100 kW, connected on either side of the meter. Community wind includes both on-site wind turbines used to offset the customer’s load and wholesale wind generation sold to an unrelated third party. Community wind projects are in the planning stages in nearly every state with wind development, and the concept is continually being re-defined as new community groups and models for ownership emerge. The key element is local ownership and local benefits.
In the United States, community wind projects are owned by farmers, schools, colleges, tribal governments, municipal utilities, local businesses, and rural electric cooperatives, to name a few. These projects have come together through hard work, local innovation, and public policies that support locally owned projects, local champions, and the need for new economic opportunities in rural America.
This section is intended to familiarize you with the Toolbox so that you can make the best use of its information, tools, and resources.
The main topics covered in this section include:
- Community Wind Toolbox
- Why Community Wind Energy?
- Organization of the Toolbox
 Community Wind Toolbox
This Toolbox is designed to give developers of community wind projects practical knowledge of what to expect when developing commercial-scale community wind energy projects in the range of 1 to 100 Megawatts (MW). These wind projects are designed for bulk power generation for sale to a utility company or large electricity user and can supply enough energy to serve several hundred to thousands of homes. The Toolbox does not apply to small-scale on-site wind systems. If you are interested in information about small or mid-sized wind turbines designed to supply energy for on-site use for a single home, farm, or small business, see Windustry’s Small Wind Page.
Typically, planning and developing a commercial-scale community wind project takes several years, working with a dedicated team of professionals that have expertise in business and finance, easements, power purchase agreements, engineering, construction and project management, and experience in the utility sector as well as other aspects of the wind industry.
The Toolbox provides insight into every aspect of the community wind development process and helpful information about managing a project from the beginning of the development process through decommissioning. It includes a primer on wind resource assessment based on current technology and industry standards, and information about financing, business structures, tax incentives and liability, the interconnection of your project and acquiring a power purchase agreement, and selecting and purchasing turbines and associated equipment. It is intended to provide prospective developers with tools for each of these steps, cost estimates, and guidance on when and where to involve outside expertise.
Developed and reviewed by a broad team of wind, legal, engineering, and financial experts, Windustry’s Community Wind Toolbox includes:
- A new pro forma model tool;
- Annotated examples of various legal agreements;
- Detailed review of policy incentives; and
- Case studies.
A community wind project has many parallels to the development of an ethanol plant or any other large energy facility. It is a multi-million dollar business that requires expertise in business, finance, and engineering, the participation of a diverse board of directors, much patience and perseverance, and equity and/or debt finance partners. It is not easy, but with the completion of a well-planned project, the rewards for a community can be great.
 Why Community Wind Energy?
The rapid expansion of wind energy can be attributed to improving economics and effective public policies. When wind is developed locally, the economic, social, and environmental advantages accrue to local farmers, landowners, and other members of the community. As a potential community wind developer, it is important that you understand both the benefits and challenges of wind energy so you can explain to others in your community how the project will help keep their power costs down and accurately answer their basic question: “Why wind?”
Economic Benefits of Community Wind
Revitalizes Rural Economies.Locally-owned and locally controlled wind development can diversify the economy of rural communities, substantially broadening the tax base. Wind turbines provide a new source of property taxes in rural areas that otherwise have a hard time attracting new industry.
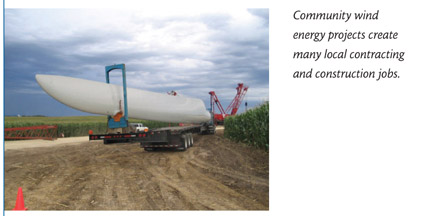
Stimulates the Local Economy. Community wind projects have higher multiplier effects and greater local returns in creating new jobs, growing business opportunities, and bringing new investment into the community than outside development, keeping energy dollars local.
Stabilizes Energy Prices. Wind as a fuel for electrical generation has zero cost and does not need to be mined or transported, removing two expensive and fluctuating aspects from long-term energy costs. Fixed-price wind projects can help hedge against fossil fuel price spikes.
Promotes Cost-Effective Generation. The cost of windgenerated electricity has fallen from nearly 40¢/kWh in the early 1980s to 2.5-8¢/kWh today depending on wind speed and project size.
Creates Jobs. Wind energy projects create new short and long term jobs. Related employment ranges from meteorologists and surveyors to structural engineers, assembly workers, lawyers, bankers, and technicians. According to a study by the New York State Energy Research and Development Authority, wind energy creates 27% more jobs than a coal plant and 66% more than a natural gas combined-cycle plant per unit of energy generated.
Social Benefits of Community Wind
Promotes Energy Independence and National Security. Local wind generation diversifies our energy portfolio and reduces our dependence on imported fossil fuels. Distributed community wind generation adds reliability to the nations electrical grid by decentralizing generation.
Creates a New Crop. Community wind is a new revenue source for farmers and rural landowners, diversifying their income. It is compatible with agricultural use of the land as wind turbines can be installed amid cropland with minimal affect on people, livestock, or agricultural production.
Promotes Local Ownership. Small clusters of turbines or even single turbines operated by local landowners and small businesses increase local control of energy production, making a significant contribution to the regional energy mix.
Galvanizes Support and Neutralizes Opposition. Increased local benefits broaden support for wind energy, engage rural and economic development interests, and build a larger constituency with a direct stake in the industry’s success. Local investment in wind can reduce local opposition to new wind farms and will cultivate local advocates.
Environmental Benefits of Community Wind
Produces Clean Electricity. Widespread community wind development addresses climate change by providing a nonpolluting source of energy that reduces greenhouse gas emissions.
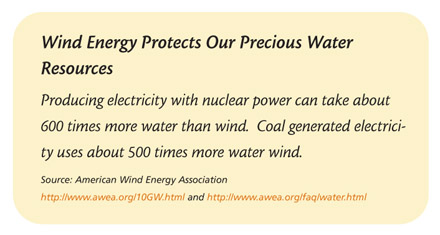
Keeps Water Sources Clean.Turbines produce no particulate emissions that contribute to mercury contamination in our lakes and streams. Wind energy also conserves water resources.
Protects Natural Resources.Harvesting the wind preserves natural resources as there is no need for destructive resource mining or fuel transportation to a processing facility.
Preserves Land. Wind farms are spaced over a large geographic area, but their actual footprint covers only a small portion of land resulting in a minimum impact on crop production or livestock grazing. Wind farms preserve open space, preventing residential sprawl.
Organization of the Toolbox
The Toolbox is modular so that prospective community wind developers can read section by section as you plan your project, refer to the checklist as needed, quickly find contact information for consultants and experts, and gain easy access to various tools. Scattered throughout Windustry’s Toolbox are examples from experienced professionals in the wind industry, valuable pieces of advice from those who have developed community wind projects, and links to Additional Resources for more indepth information on the issues at hand.
Throughout the Toolbox you will come across a number of useful icons that will alert you to special pieces of information:
 Best Practices
![]() Caution
Caution
![]() Links to more information
Links to more information
![]() Information that will affect your project’s bottom line
Information that will affect your project’s bottom line
![]() Example
Example
The Toolbox begins with a description of the key players of the wind industry, an overview of community wind development, and checklist of key development steps.
Conclusion
Wind energy is rapidly expanding across the U.S., but much more needs to be done so that community wind can reach its full potential. Wind energy offers many significant benefits to the communities that choose to get involved in project development. Developing wind energy can be a complicated process requiring substantial time and effort, but it can also be very rewarding, both financially and on a personal level. Windustry’s Toolbox will help guide you through the process of wholesale community wind development and put you on the path toward becoming a community wind farmer!